
FilledPlot.
 |
 |
| JavaView Snapshot | Mathematica Snapshot |
| JavaView Applet | JavaView Lite Applet |
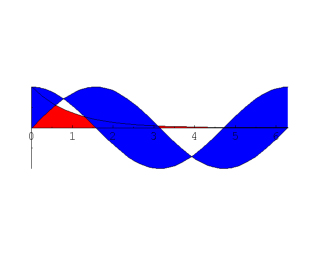
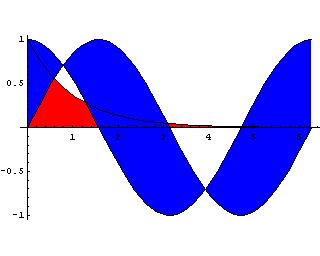
| This specifies which curves to fill between and the colors of the filled regions. | In[1]:=
<< Graphics`FilledPlot` In[2]:= fp = FilledPlot[{Exp[-x], Cos[x], Sin[x]}, {x, 0, 2 Pi}, Fills -> {{{1, Axis}, RGBColor[1, 0, 0]}, {{3, 2}, RGBColor[0, 0, 1]}}, Curves -> Front] In[3]:= JavaView[fp] |