
GraphicsArray.
 |
 |
| JavaView Snapshot | Mathematica Snapshot |
| JavaView Applet | JavaView Lite Applet |
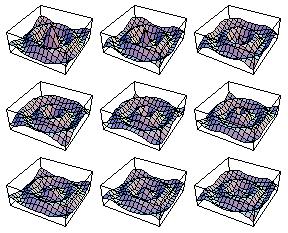
| This generates a list of graphics objects. Setting DisplayFunction -> Identity stops
Plot3D from rendering the graphics it produces. Explicitly setting PlotRange ensures that the scale is the same in each
piece of graphics. The command GraphicsArray[] partitions the graphics into three rows, and shows the resulting array of images. |
In[1]:=
table = Table[ Plot3D[BesselJ[0, Sqrt[x2 + y2] + t], {x, -10, 10}, {y, -10, 10}, Axes ->
False, PlotRange -> {-0.5, 1.0}, DisplayFunction -> Identity], {t, 0, 8}] In[2]:= gt = GraphicsArray[Partition[table, 3]]; In[3]:= JavaView[gt] |