
Legend. - Not supported yet.
 |
 |
| JavaView Snapshot | Mathematica Snapshot |
| JavaView Applet | JavaView Lite Applet |
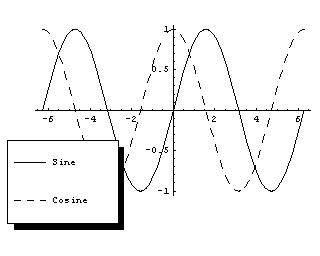
| This shows sine and cosine curves with a legend. JavaView fails : Graphics inside a rectangle command are not parsed. | In[1]:=
<<Graphics`Legend` In[2]:= l = Plot[{Sin[x], Cos[x]}, {x, -2 Pi, 2 Pi}, PlotStyle -> {GrayLevel[0], Dashing[{.03}]}, PlotLegend -> {"Sine", "Cosine"}]; In[3]:= JavaView[l] |