
MeshRange.
When defining a MeshRange it makes sense to use the same values used for z value computation.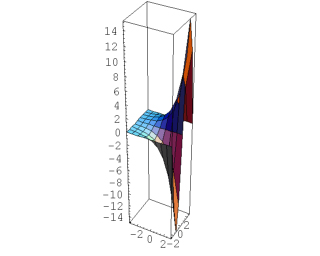 |
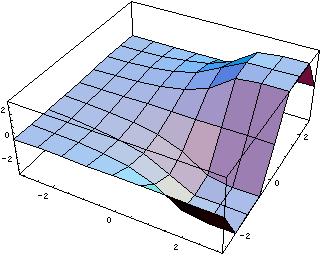 |
| JavaView Snapshot | Mathematica Snapshot |
| JavaView Applet | JavaView Lite Applet |
| MeshRange is an option for ListPlot3D, SurfaceGraphics, ListContourPlot, ListDensityPlot and related functions which specifies the range of a and a coordinates that correspond to the array of a values given. | In[1]:=
mr = SurfaceGraphics[Table[Sin[x]*Exp[y], {x, -Pi, Pi, Pi/4.}, {y, -E, E, E/4.}], MeshRange -> {{-Pi, Pi}, {-E, E}}, Axes -> True]; Show[mr] In[2]:= JavaView[mr] |